AI Graph Maker is an online tool that helps users quickly generate charts. Simply put, it uses advanced AI technology to compile input data and prompts, then presents the information in chart form. This enables the rapid creation of professional charts in seconds. Not only that, users can adjust different chart color schemes. If minor issues are found in the generated chart, data can be tweaked using the editing function.
According to the instructions, AI Graph Maker can create various chart types, including pie charts, line graphs, bar charts, flowcharts, timelines, ER diagrams, mind maps, and Gantt charts. By default, it automatically identifies and selects the most suitable type, though manual selection is also possible when needed.
Finally, quickly download your chart as a PNG file. The entire process requires no account registration, making it easy for both beginners and professionals to get started. Previously, I've also recommended several chart creation tools, such as:
Graphy: A free online chart creation tool supporting multiple data presentation formats
Pie Chart Maker: An easy-to-use pie chart creation tool offering downloads in three formats
Meta-Chart: A free online chart creation tool that transforms data into visual statistical graphs
How to Use AI Graph Maker?
1. Launch the tool and select your language
After launching AI Graph Maker, you'll see a feature overview and the types of charts you can generate with the AI chart creation tool. Note that the Simplified Chinese and Traditional Chinese versions of the tool differ. The Simplified Chinese version offers more features and produces better-looking charts. Remember not to switch the language to Traditional Chinese (it seems the Simplified Chinese version is newer, while the Traditional Chinese version might not have been updated yet?).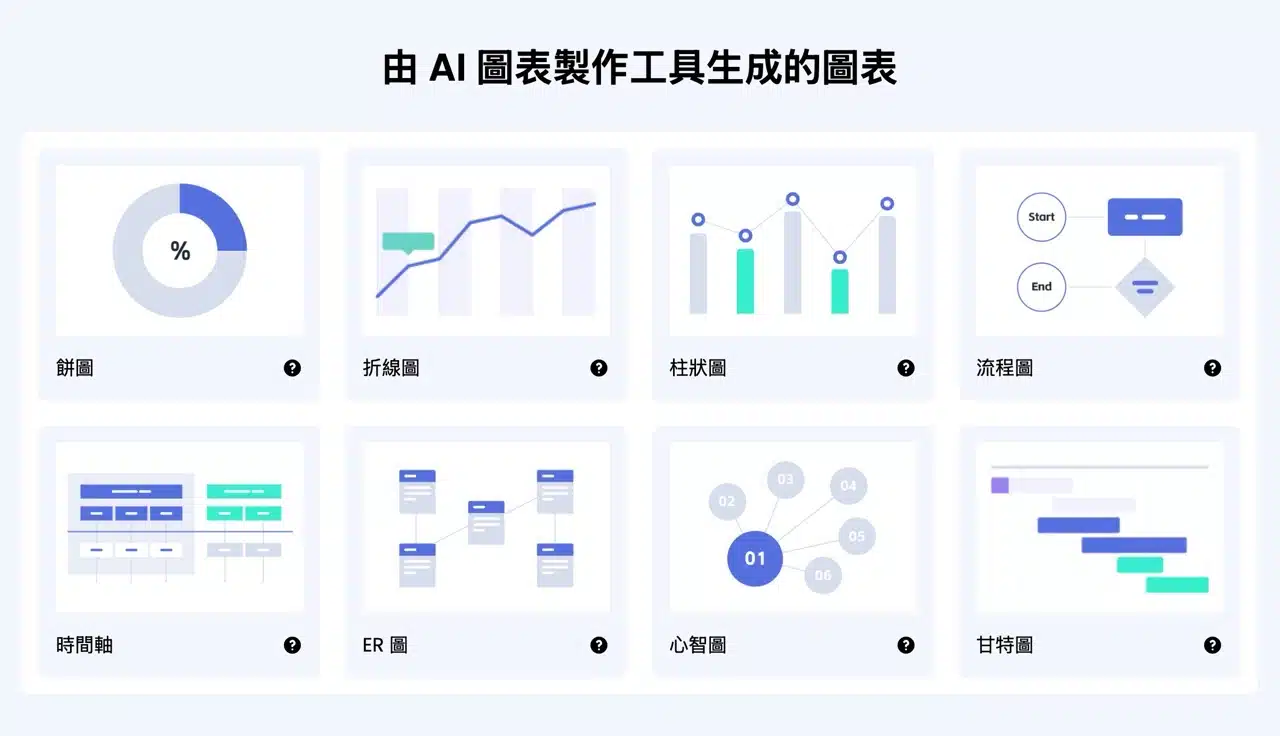
Click examples below the AI chart generator to quickly load test content. Generate charts like sales data bar charts, website traffic analysis line graphs, department employee pie charts, or student performance radar comparison charts.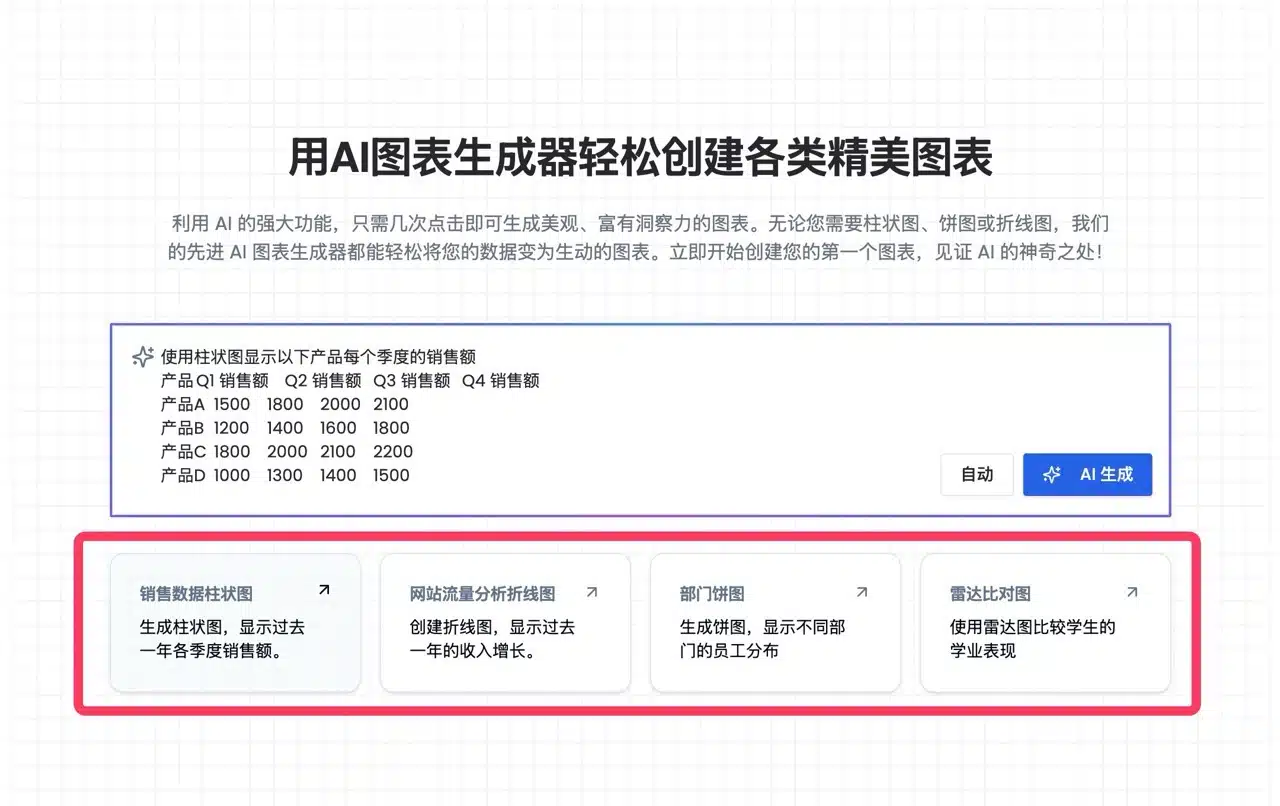
2. Manually Select Chart Type
A “Chart Type Selection” field is located in the bottom-right corner. By default, it uses “Auto” detection, but users can manually choose based on their needs. AI Graph Maker supports the following types: line charts, bar charts, radar charts, pie charts, tree maps, scatter plots, relationship diagrams, Sankey diagrams, and funnel charts.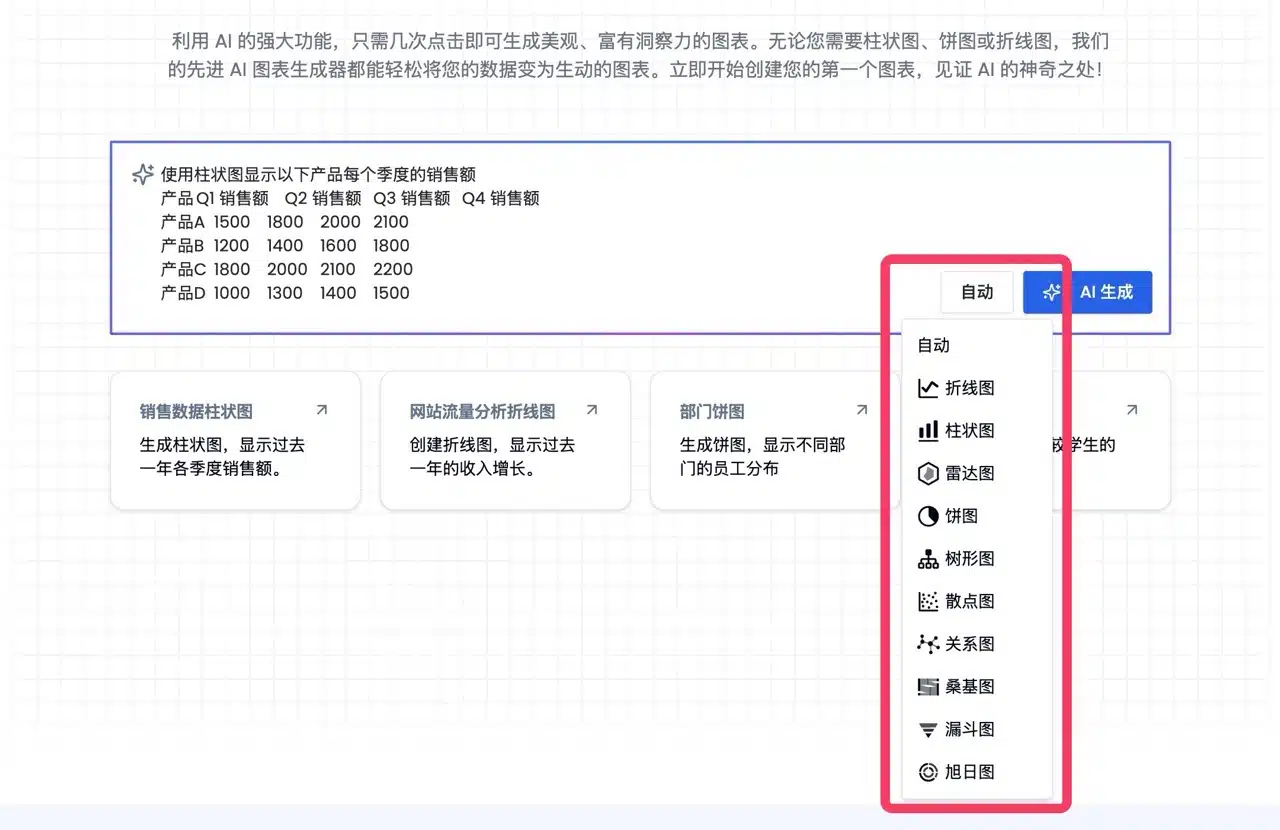
3. Quick Testing with Examples
The chart below was created using AI Graph Maker's sample templates. Users simply paste relevant data, and the AI handles the rest to generate the image—the entire process takes just seconds, demonstrating remarkable efficiency.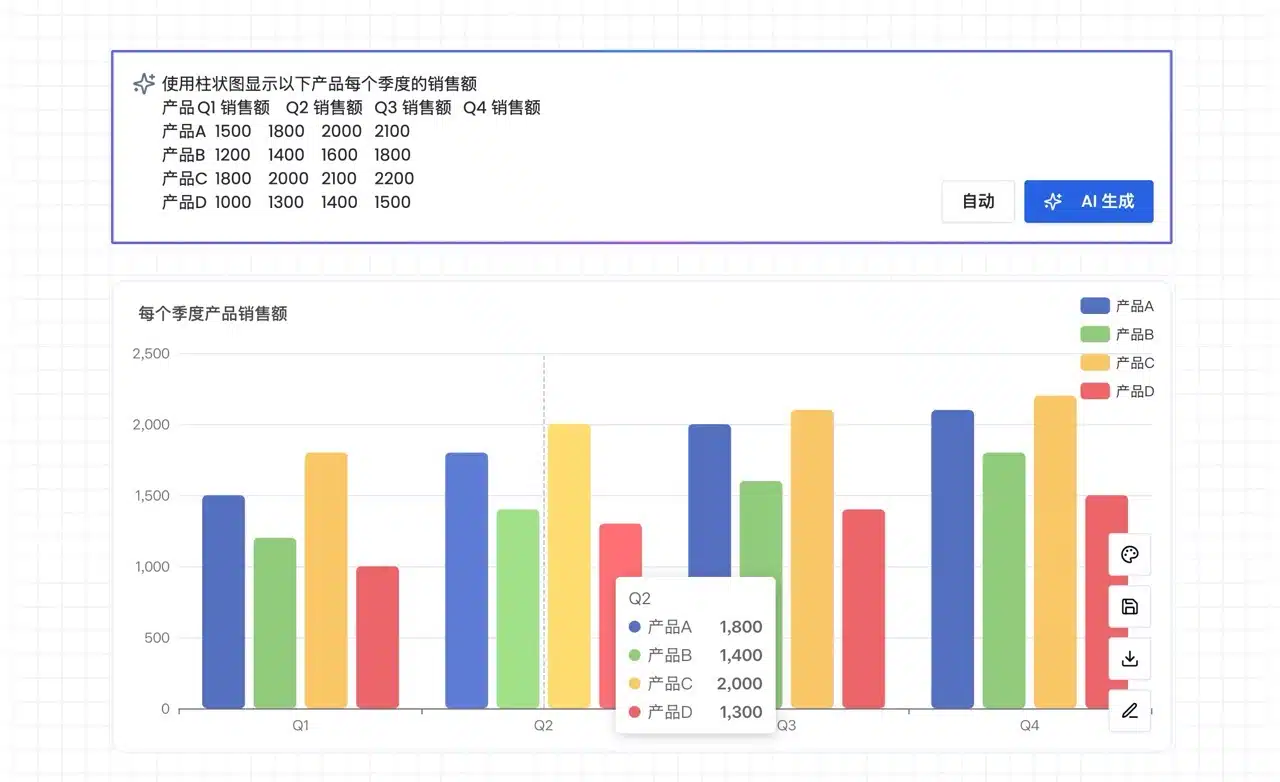
4. Paste Data and Prompt to Generate Charts
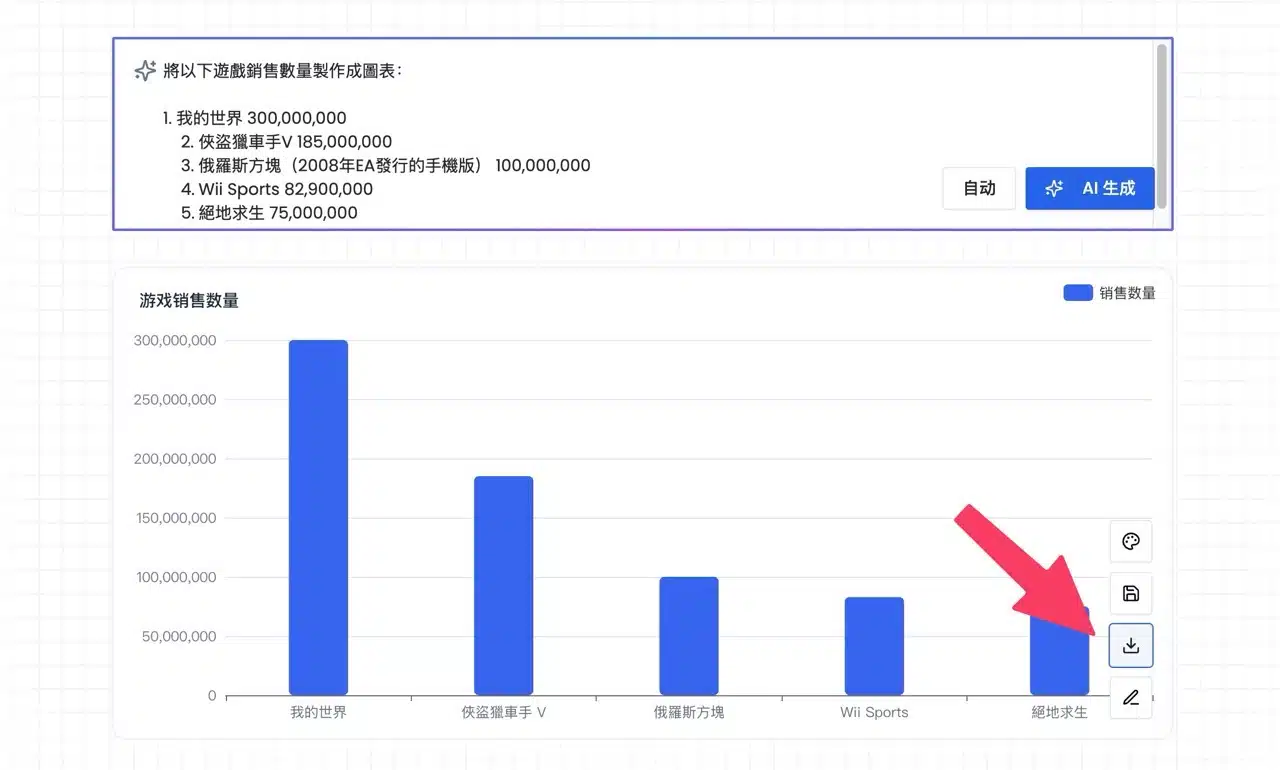
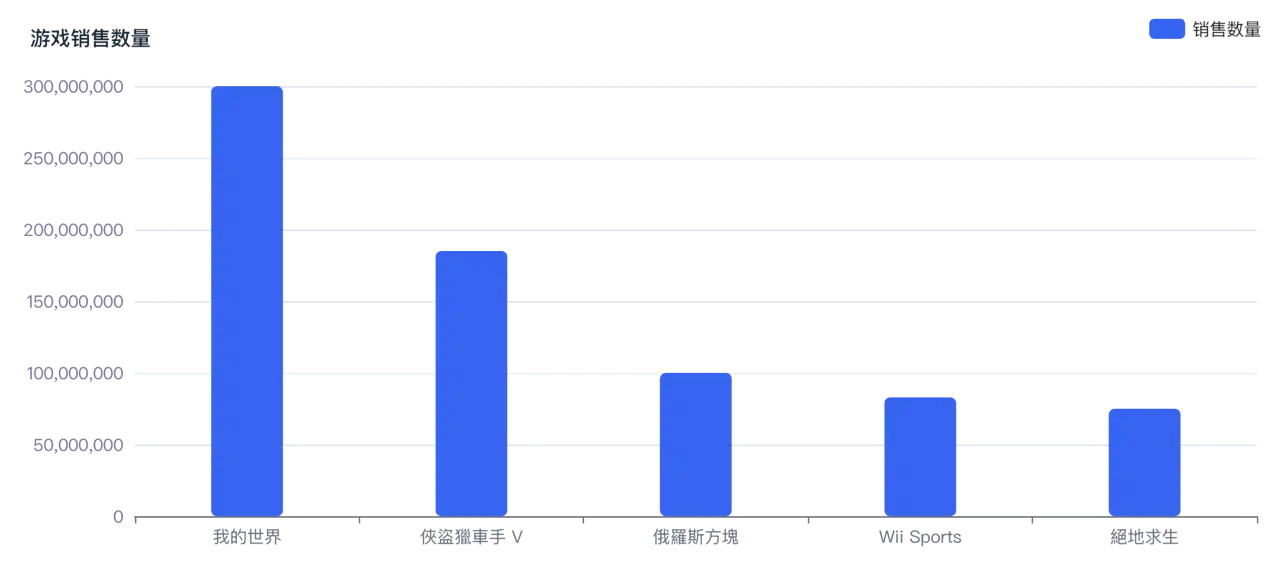
I also tried finding some sample data. By adding a prompt (asking the AI to convert the content into a chart) and clicking “AI Generate” in the bottom-right corner,
AI Graph Maker instantly created a bar chart. It can also adjust units, display names, or other presentation styles based on user needs.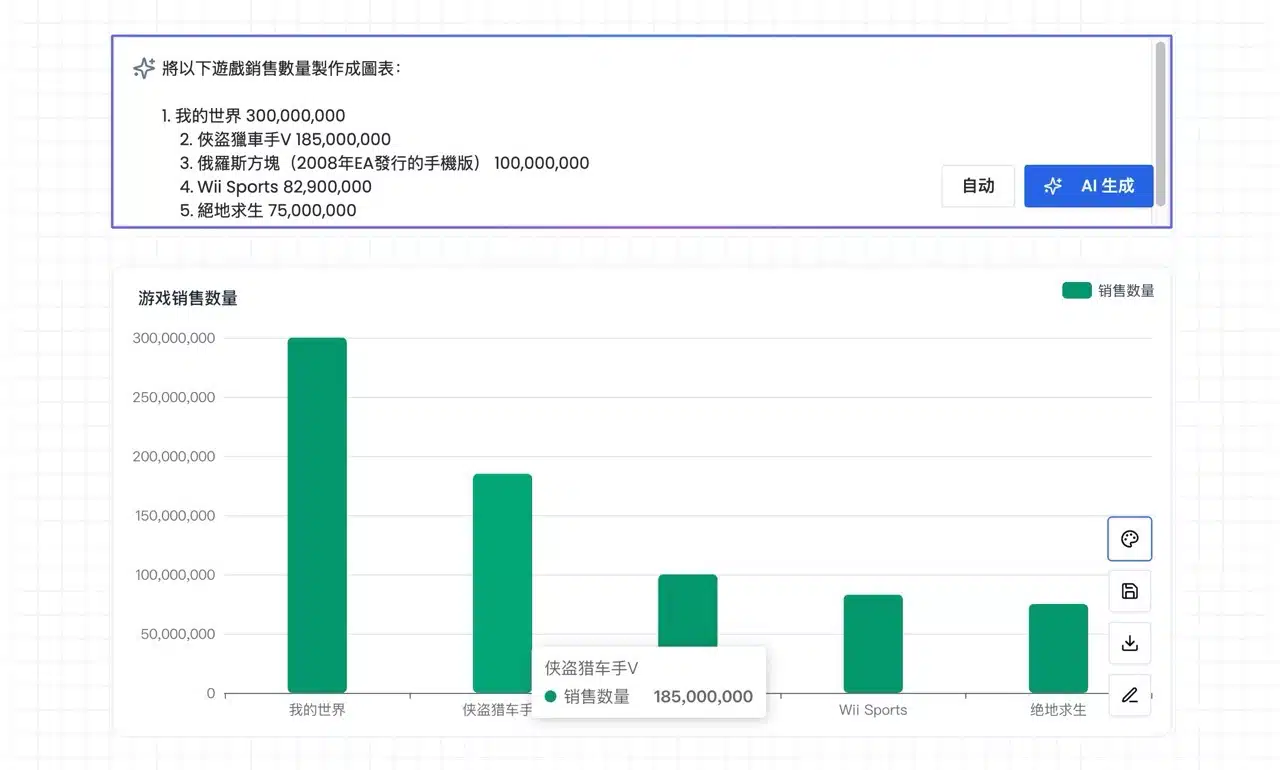
5. Adjusting color schemes and editing text
Access the “Color Palette” option via the button in the chart's bottom-right corner to quickly switch the chart to different color combinations.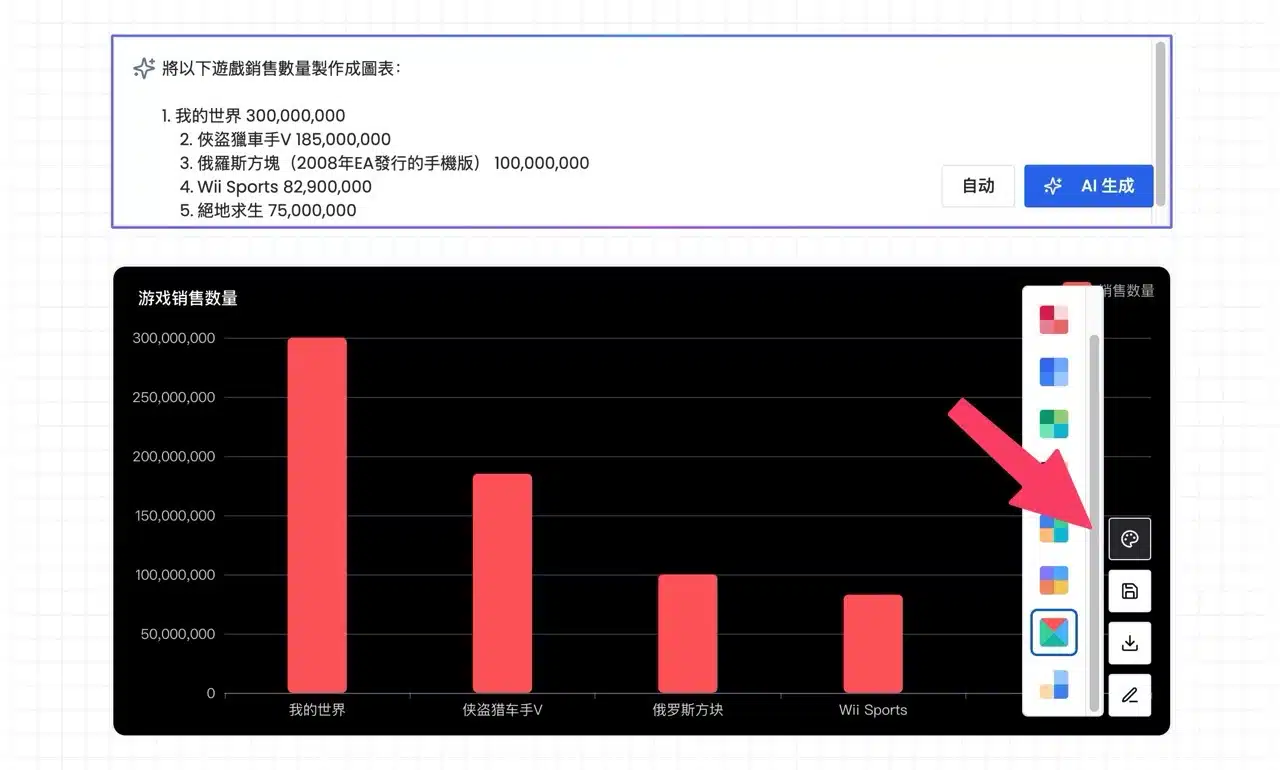
I noticed that charts generated using the “Simplified Chinese” version automatically display Simplified Chinese text. However, this is easily fixed by clicking the “Edit Chart Data” button in the bottom-right corner to reconfigure and adjust the displayed text and numbers for each chart item.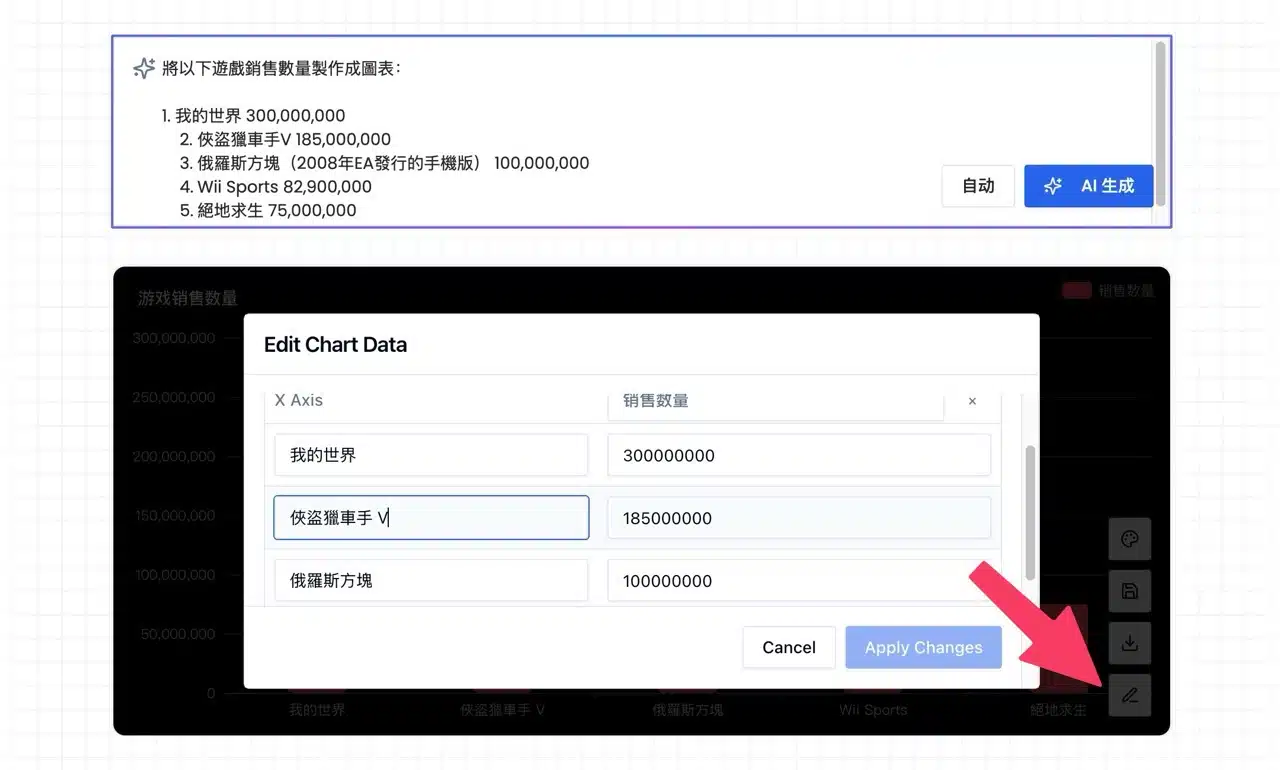
6. Finally, locate the “Download” button in the bottom-right corner of the chart to save it as a PNG file.